
We’ve picked our small group of children (Sample), but how many children should be in that group? This is the question of Sample Size.
If we pick too few children, our results might be wrong just by luck (like flipping a coin only 5 times and getting 4 heads). If we pick too many, we waste time and money. This chapter explains the scientific way to find the perfect number of children we need to be sure SuperPaste works.
1. The Ingredients for Sample Size Calculation
There is no magic number! To calculate the necessary Sample Size (n), the scientist needs specific ingredients from the investigator (us):
| Ingredient | Medical Terminology | Simple Idea |
| Main Fact | Major Study Variable | What is the one most important thing we are measuring? (e.g., the rate of Dental Caries). |
| Expected Rate | Expected Frequency (or Proportion, p) | What percentage of children usually get Dental Caries? (If it’s rare, we need a huge sample). |
| Accuracy Goal | Precision (d) | How close do we want our study result to be to the true result? (e.g., within 4% of the true rate). |
| Confidence Level | Alpha (\alpha) | How sure do we want to be that our finding is not due to luck? (Usually 95\% confidence, or \alpha = 0.05). |
| Detection Power | Beta (\beta) and Power (1 – \beta) | If SuperPaste actually works, how sure do we want to be that our study detects that effect? (Usually 80\% Power, or \beta = 0.20). |
2. The Two Types of Risk (Error)
In research, we always deal with two types of risk when drawing conclusions:
| Ingredient | Medical Terminology | Simple Idea |
| Main Fact | Major Study Variable | What is the one most important thing we are measuring? (e.g., the rate of Dental Caries). |
| Expected Rate | Expected Frequency (or Proportion, p) | What percentage of children usually get Dental Caries? (If it’s rare, we need a huge sample). |
| Accuracy Goal | Precision (d) | How close do we want our study result to be to the true result? (e.g., within 4% of the true rate). |
| Confidence Level | Alpha (alpha) | How sure do we want to be that our finding is not due to luck? (Usually 95% confidence, or alpha = 0.05). |
| Detection Power | Beta (beta) and Power (1 – beta) | If SuperPaste actually works, how sure do we want to be that our study detects that effect? (Usually 80% Power, or beta = 0.20). |
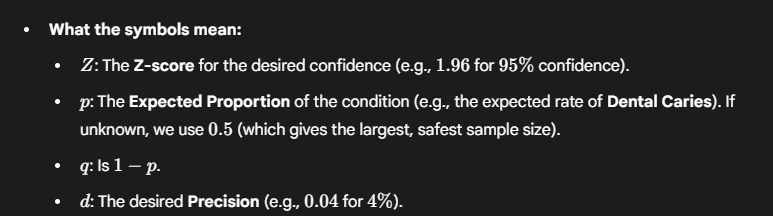
3. Formulas: Estimating a Proportion (Prevalence)
Let’s say we just want to estimate the Prevalence (proportion) of Dental Caries in the whole population, not test the paste yet.
The formula is used to find the minimum n required to be 95% confident that our result is within a certain Precision (d) of the true rate.

4. Formulas: Analytical Studies (Testing the Paste)
When we compare two groups (SuperPaste users vs. Regular Paste users), the sample size calculation becomes about detecting a difference or an association. The sample size depends on the expected difference between the groups (the Odds Ratio or Relative Risk).
- The Rule of Difference:
- If we want to detect a small effect (SuperPaste is only slightly better), we need a large sample size to find that tiny difference.
- If we want to detect a large effect (SuperPaste is much, much better), we need a small sample size.
Adjustment Factors (Keeping the Sample Safe)
Once we calculate n, we often adjust it to make the study stronger:
- Non-Response: Add 10\% to the final n to account for children who drop out.
- Confounders: Add 10\% to the final n for every major confounder we plan to adjust for in the analysis (e.g., if we adjust for Age and Income, we might add 20\%).
- Cluster Effect: If we used Cluster Sampling (picking whole schools), we multiply n by a factor called the Design Effect because children in the same school are not fully independent.

Leave a Reply