
Hello! We’ve collected a huge sack of information from all the children in our SuperPaste study. Before we can tell if the paste works, we have to organize and summarize these facts, which are called Data. This whole process is known as Measurement of Study Variables.
1. Sorting the Treasure: Types of Data
First, we sort all the Data we collected into two main categories: Qualitative (words/categories) and Quantitative (numbers).
| Category | Type of Data | Simple Explanation | SuperPaste Example |
| Qualitative | Nominal Data | Labels or groups that cannot be put in any order. | The brand of the child’s Toothbrush (Brand X, Brand Y). |
| Ordinal Data | Categories that can be ranked or put in a clear order. | The Severity of Dental Caries: 1 (Mild), 2 (Moderate), 3 (Severe). | |
| Quantitative | Discrete Data | Numbers that must be whole, countable integers. | The number of siblings each participant has. |
| Continuous Data | Measurements that can take any value, including decimals (like on a smooth scale). | The child’s Weight (Kg) or Age (years). |
2. Finding the Middle: Measures of Central Tendency
To find one single number that best represents the entire group, we use a measure of the “average,” called Central Tendency.
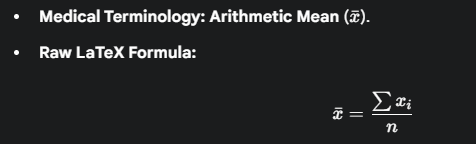
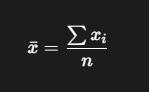
A. Mean ($\bar{x}$)
This is the most common average. We find the Mean Age of all children in the study by adding up every single age and then dividing by the total number of children (n).
B. Median
Imagine we line up all the children based on their Weight from lightest to heaviest. The Median is simply the weight of the child standing exactly in the middle.
- Simple Idea: The Median is important because it is not easily fooled by a single child who is extremely heavy or light (an extreme value or outlier).
C. Mode
The Mode is just the value or category that appears most often.
- Example: If the most frequent problem reported by the children’s parents is Gingivitis, then Gingivitis is the Mode Diagnosis in our study.
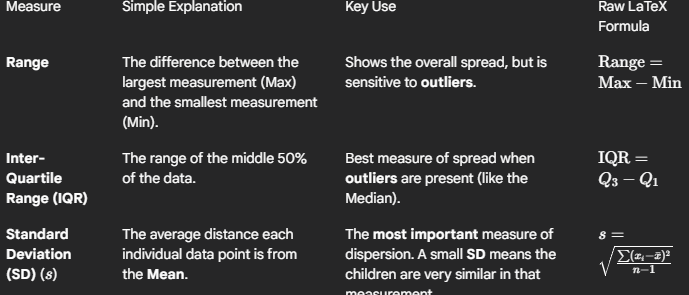
3. How Spread Out: Measures of Dispersion
Knowing the average isn’t enough; we need to know how spread out the individual measurements are from that average. This is called Dispersion or Variability.
Coefficient of Variation (CV)
We use the Coefficient of Variation (CV) when we want to compare the variability of two completely different measurements (e.g., comparing the spread of Age vs. the spread of Weight). It removes the units, giving us a pure percentage.

Leave a Reply